to answer:
- Is there a relationship between feature advertising budget and sales?
- How strong is the relationship between advertising budget and sales?
- Which media are associated with sales?
- How large is the association between each medium and slaes?
- How accurately we can predict future sales?
- Is there synergy among the advertising media?
Single Linear Regression
$$ Y \approx \beta_0 + \beta_1 X$$
RSS (Residual Sum Squared)
let $\hat{y_i} = \hat{\beta_0} + \hat{\beta_1} x_i$ be the prediction of $y$ based on the $i$th value of $X$. then $e_i$ represent the $i$th residual (difference between true y and predicted y)
$$RSS = \sum_{i=1}^{n}e_i^2 = \sum_{i=1}^{n}(y_i-\hat{y_i})^2 $$
Standard Error
$$Var(\hat{\mu}) = SE(\hat{\mu})^2 = (\frac{\sigma}{\sqrt{n}})^2$$
we can also compute the standard Error for $\beta$
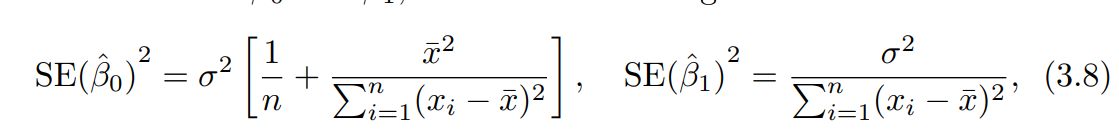 image source: screenshot from https://hastie.su.domains/ISLR2/ISLRv2_website.pdf chapter 3
proof: https://www.youtube.com/watch?v=rODUBTRUV0U&t=317s
notice that $SE(\hat{\beta_1})$ is smaller when the $x_i$ are more spread out; intuitively we have more leverage to estimate slope when this is the case.
standard error can be used to compute Confidence Interval
Info
title: Confidence Interval A 95 % confidence interval confidence interval is defined as a range of values such that with 95 % probability, the range will contain the true unknown value of the parameter.
the 95 % confidence interval for β1 approximately takes the form $$\beta_1 - 2 SE(\hat{\beta_1}), \beta_1 + 2 SE(\hat{\beta_1})$$
Is there a relationship between $X$ and $Y$?
we can form a hypothesis testing namely: $H_0$ : No relationship between X and Y ($\beta_0 = 0$) $H_1$ : There is some relationship between X and Y ($\beta_0 \neq 0$) now we need to test if $\beta_0$ sufficiently far from 0, in practice we use t-statistic: $$t = \frac{\hat{\beta_1} - 0}{SE(\hat{\beta_1})}$$
$R^2$ Statistic
meassure the proportion ofvariability in Y that can be explained using X the porpotion of variance explained we define $TSS = \sum (y_i - \bar{y})^2$
$$R^2 = \frac{var(\bar{y}) - var(\hat{y})}{var(\bar{y})} = \frac{TSS - RSS}{TSS}$$ TSS can be thought as amount of variability inherent in the response before regression is performed.
References
ISLR chapter 3